DNA Methylation Pipeline: Test Run Report
A short report from running the DNA methylation pipeline on a small test set of public Illumina 450K arrays (four samples: two labelled Meningioma and two Dura). All sections below are generated directly from the pipeline’s output files.
Overview
This report summarises a run of the DNA methylation pipeline (test) on a small set of public Illumina 450K arrays. The pipeline processes IDATs with sesame, runs QC, calls copy-number alterations with conumee2, classifies samples, and finds differentially methylated regions with DMRcate.
Sample QC
4 samples were processed. Flagged samples are marked in the table.
| Sample_ID | frac_dt_mk | mean_intensity_MU | RGdistort | any_flag | flag_reason |
|---|---|---|---|---|---|
| GSM5380774 | 1 | 6792.606 | 1.099 | FALSE | sex_mismatch |
| GSM5380775 | 1 | 9496.845 | 1.083 | FALSE | sex_mismatch |
| GSM5380776 | 1 | 10951.251 | 1.101 | FALSE | |
| GSM5380777 | 1 | 12818.100 | 1.097 | FALSE |
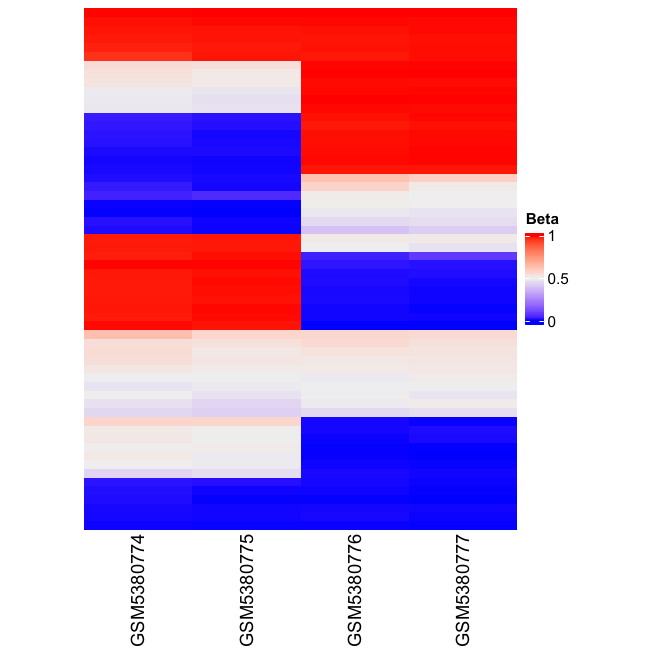
SNP-probe heatmap
Samples from the same individual should cluster together.
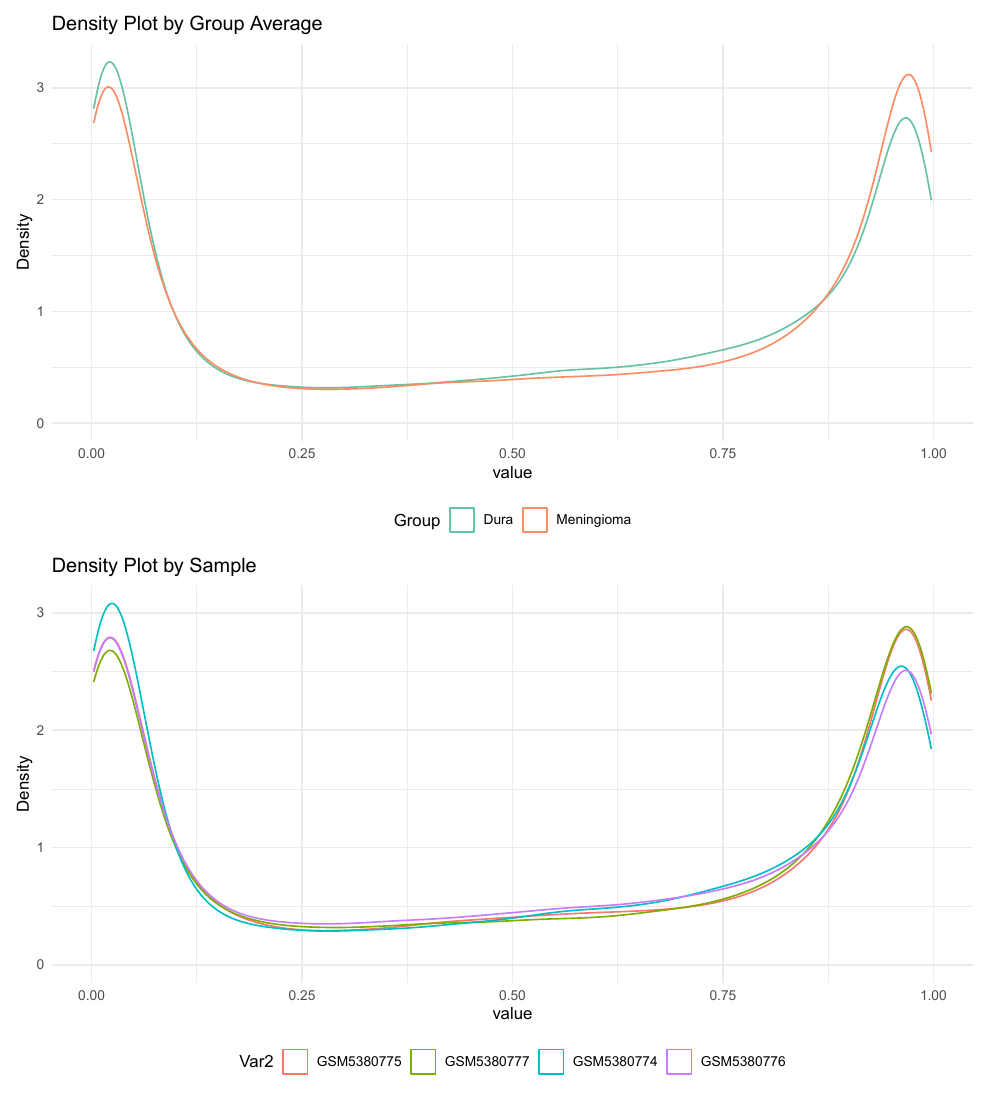
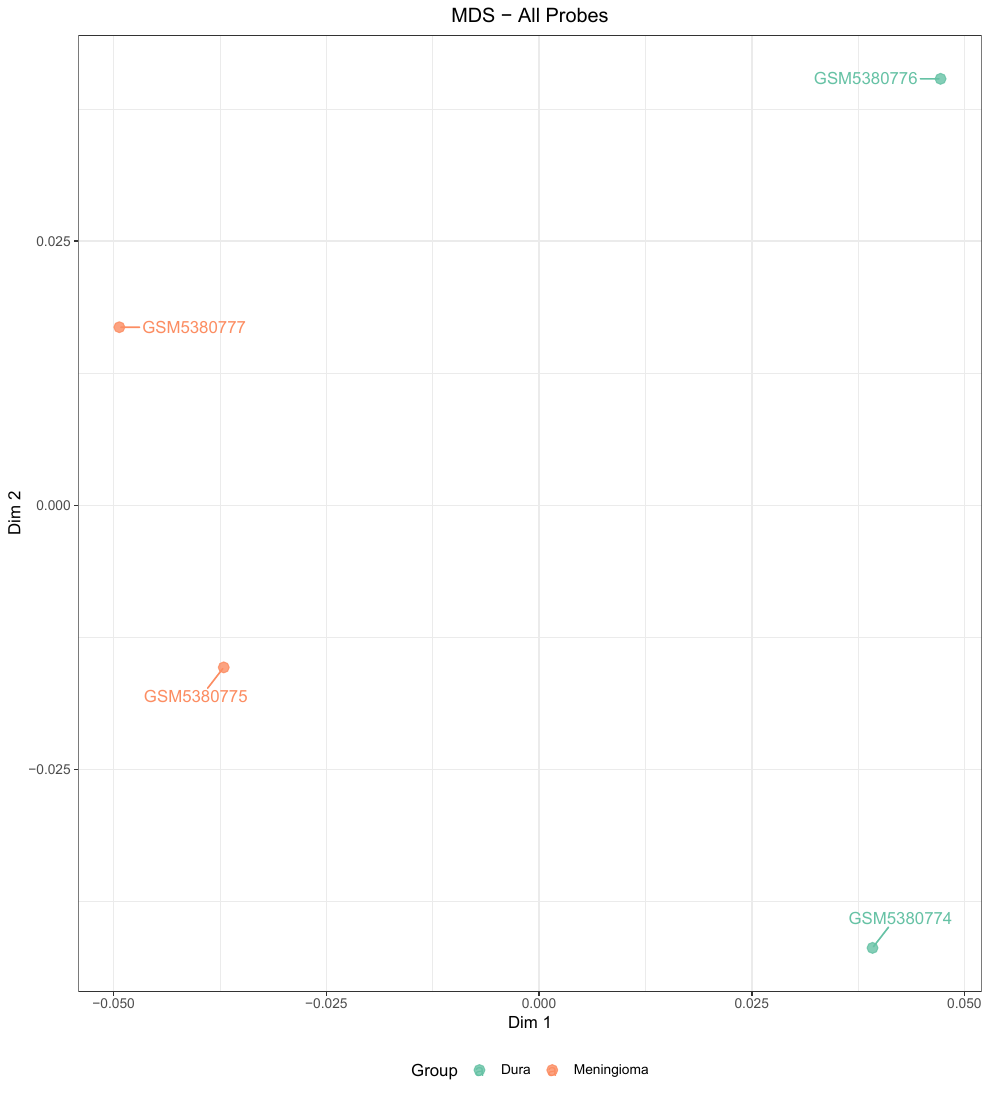
Beta-value distributions and MDS
Density plots (by group and by sample) and an MDS plot of the cleaned beta values after detection p-value, SNP, cross-hybridising and replicate-probe filtering.
Copy-number alterations
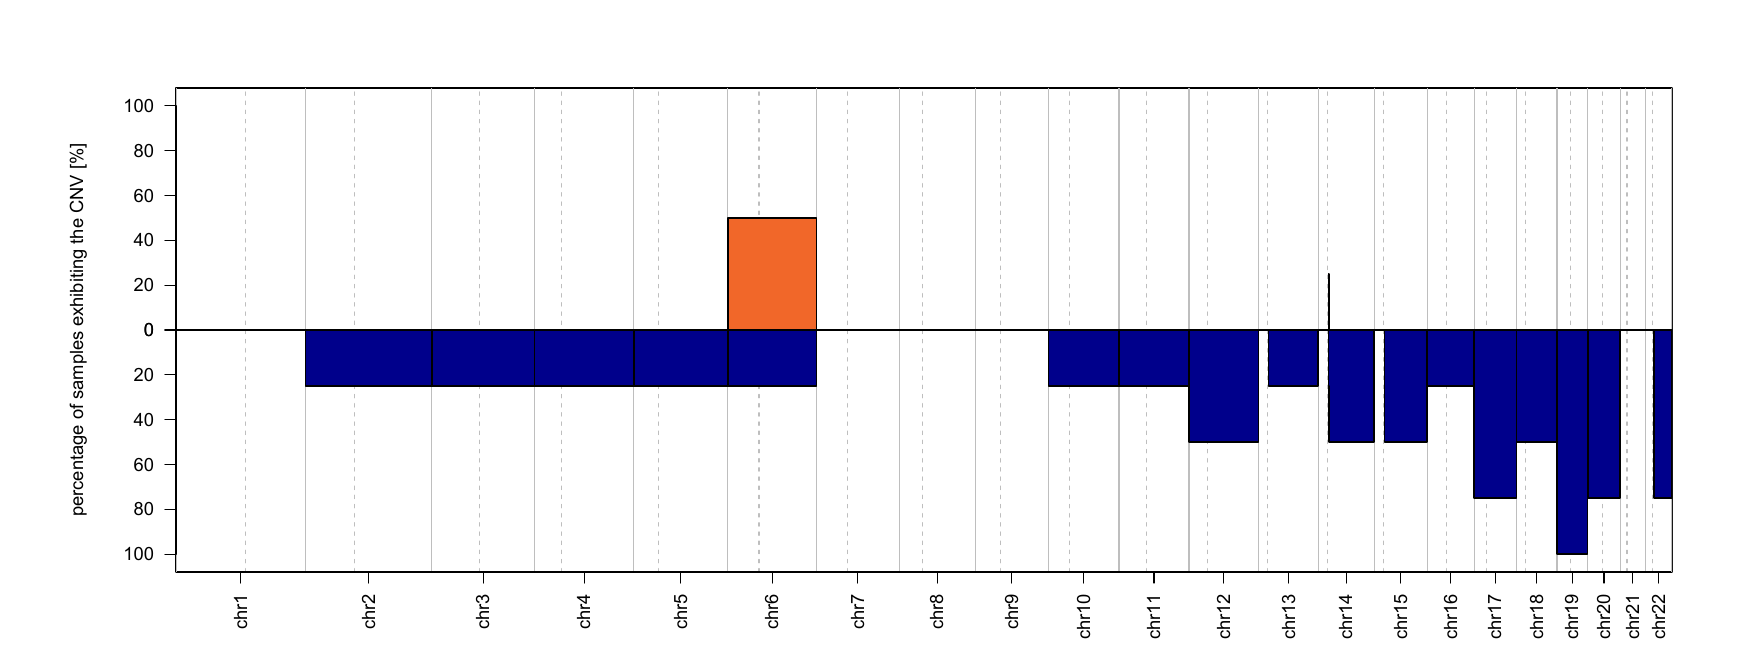
Number of CNA segments per sample:
| Sample | Freq |
|---|---|
| GSM5380774 | 22 |
| GSM5380775 | 22 |
| GSM5380776 | 23 |
| GSM5380777 | 22 |
Methylation classifier
| Sample_ID | DNA_methylation_group | DNA_methylation_subgroup |
|---|---|---|
| GSM5380775 | Immune-enriched | Immune-enriched |
| GSM5380777 | Merlin-intact | Merlin-intact |
| GSM5380774 | Immune-enriched | Immune-enriched |
| GSM5380776 | Immune-enriched | Immune-enriched |
Differentially methylated regions (DMRcate)
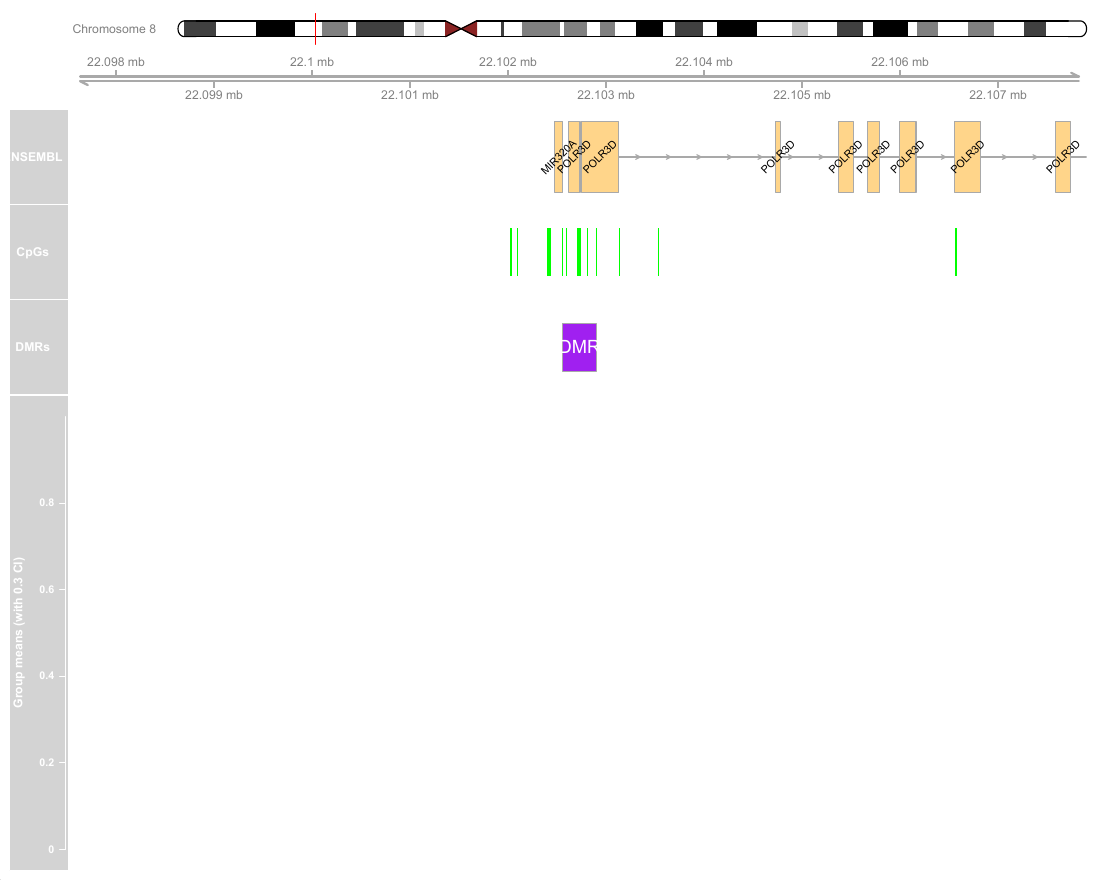
1 DMRs were called. Top 1 by minimum smoothed FDR:
| contrast | seqnames | start | end | width | no.cpgs | min_smoothed_fdr | meandiff | overlapping.genes |
|---|---|---|---|---|---|---|---|---|
| Meningioma_vs_Dura | chr8 | 22102556 | 22102902 | 347 | 8 | 0 | -0.124 | POLR3D, MIR320A |
Differential methylation heatmaps
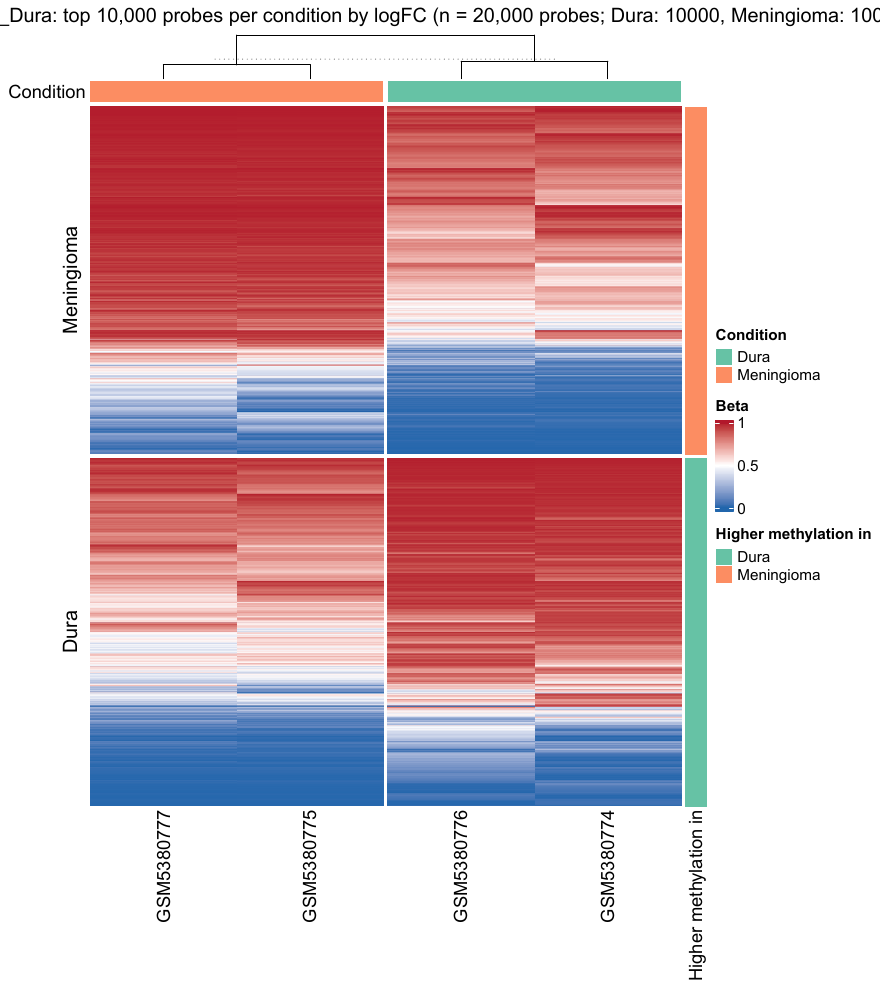
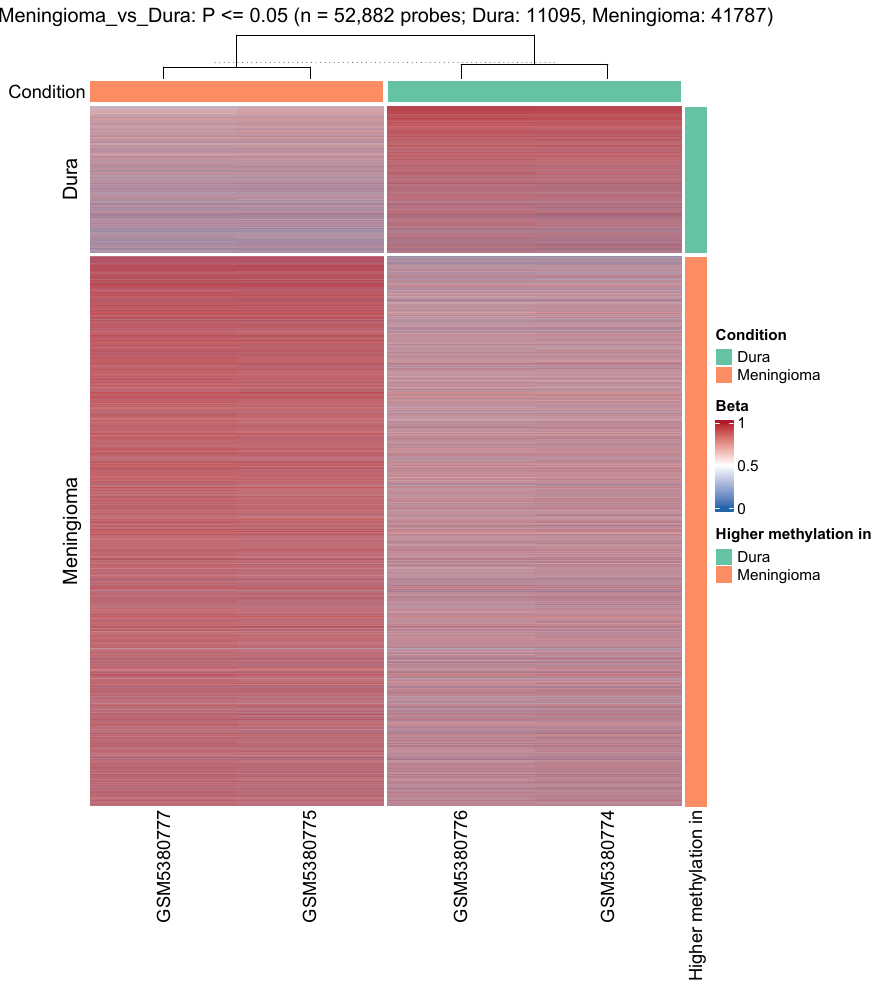
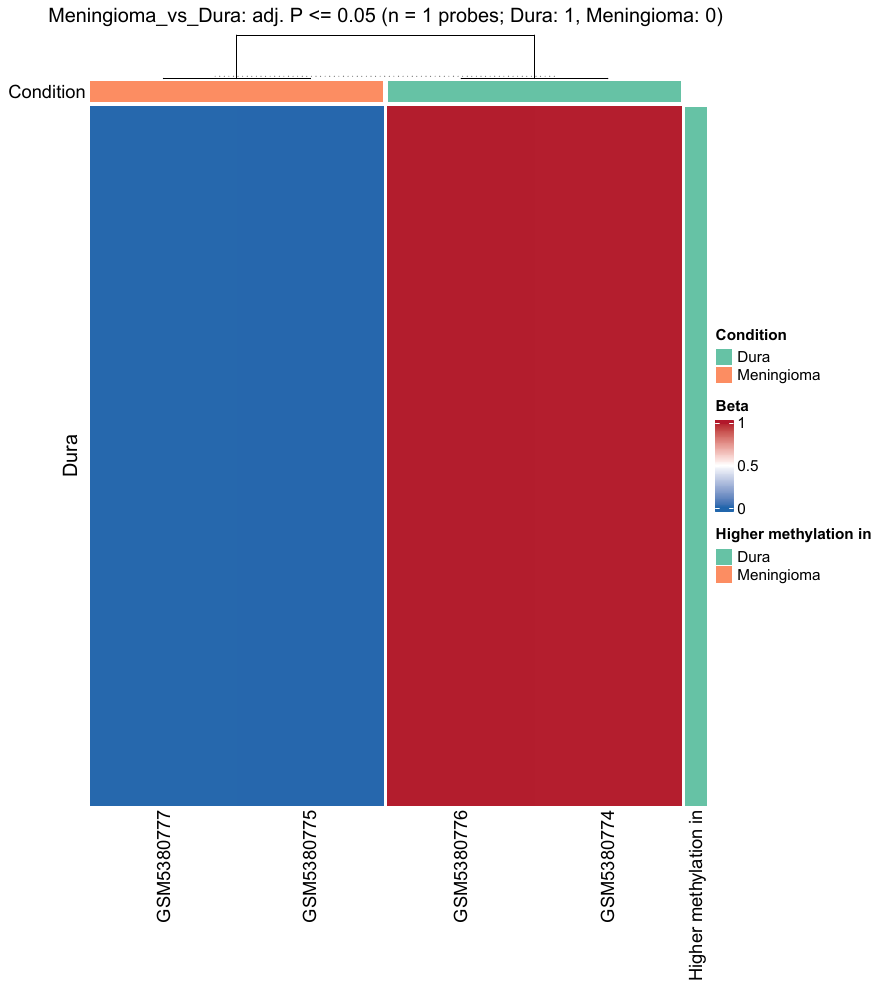
Beta values for the top probes per condition, probes with P <= 0.05 and probes with adjusted P <= 0.05. Columns are annotated by condition and rows by the condition with higher methylation.
Generated from pipeline outputs on 2026-10-07.